What is Price Action? – Price Action Trading Explained
什么是价格行为?– 价格行为交易解释
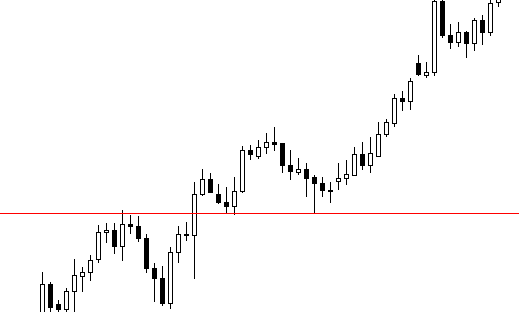
Price action trading is a methodology for financial market speculation which consists of the analysis of basic price movement across time. It’s used by many retail traders and often by institutional traders and hedge fund managers to make predictions on the future direction of the price of a security or financial market.
价格行为交易是一种金融市场投机方法,包括对基本价格随时间变动的分析。许多散户交易员以及机构交易员和对冲基金经理经常使用它来预测证券或金融市场价格的未来走向。
Put simply, price action is how price changes, i.e., the ‘action’ of price. It’s most easily observed in markets with high liquidity and volatility, but really anything that is bought or sold in a free market will generate price action.
简而言之,价格行为就是价格的变化方式,即价格的“作用”。在流动性和波动性高的市场中最容易观察到这种情况,但实际上,在自由市场中买卖的任何东西都会产生价格行为。

Price action trading ignores the fundamental factors that influence a market’s movement, and instead it looks primarily at the market’s price history, that is to say its price movement across a period of time. Thus, price action is a form a technical analysis, but what differentiates it from most forms of technical analysis is that its main focus is on the relationship of a market’s current price to its past or recent prices, as opposed to ‘second-hand’ values that are derived from that price history.
价格行为交易忽略了影响市场走势的基本因素,而是主要关注市场的价格历史,即它在一段时间内的价格变动。因此,价格行为是一种技术分析形式,但它与大多数形式的技术分析的不同之处在于,它的主要关注点是市场当前价格与其过去或近期价格的关系,而不是从该价格历史中得出的“二手”价值。
In other words, price action trading is a ‘pure’ form of technical analysis since it includes no second-hand, price-derived indicators. Price action traders are solely concerned with the first-hand data a market generates about itself; it’s price movement over time.
换句话说,价格行为交易是一种“纯粹”的技术分析形式,因为它不包括二手的价格衍生指标。价格行为交易者只关心市场产生的关于自身的第一手数据;它是价格随时间的变化。
- Price action analysis allows a trader to make sense of a market’s price movement and provides him or her with explanations that serve as way for the trader to build a mental scenario to describe the current market structure. Experienced price action traders often attribute their unique mental understanding and ‘gut feel’ of a market as the main reason for their profitable trading.
价格行为分析使交易者能够理解市场的价格变动,并为他或她提供解释,作为交易者构建心理场景来描述当前市场结构的方法。经验丰富的价格行为交易者通常将他们独特的心理理解和对市场的“直觉”归因于他们交易获利的主要原因。
Price action traders make use of the past history of a market’s price movement, most typically focus on the recent price action of the last 3 to 6 months, with a lighter focus on more distant price history. This price history includes swing highs and swing lows in a market, as well as support and resistance levels.
价格行为交易者利用市场价格变动的过去历史,通常关注过去 3 到 6 个月的近期价格走势,而较少关注更遥远的价格历史。此价格历史记录包括市场的波动高点和波动低点,以及支撑位和阻力位。
A trader can use a market’s price action to try and describe the human thought process behind a market’s movement. Every participant in a market will leave price action ‘clues’ on a market’s price chart as they trade their markets, these clues can then be interpreted and used to try and predict the next move in a market.
交易者可以使用市场的价格行为来尝试描述市场走势背后的人类思维过程。市场中的每个参与者在交易市场时都会在市场价格图表上留下价格行为“线索”,然后可以解释这些线索并用于尝试预测市场的下一步行动。
Price Action Trading – Keeping it Simple
价格行为交易 – 保持简单
Price action traders often use the phrase “Keep It Simple Stupid” in reference to the fact that trading is something many people over-complicate by clouding their charts with numerous technical indicators and generally over-analyzing a market.
价格行为交易者经常使用“Keep It Simple Stupid”这句话来指代这样一个事实,即交易是许多人通过用大量技术指标来掩盖他们的图表并且通常过度分析市场而使交易变得过于复杂。
- Price action trading is also sometimes referred to as ‘clean chart trading’, ‘naked trading’, ‘raw or natural trading’, in reference to trading from a simple price action only price chart.
价格行为交易有时也被称为“干净图表交易”、“裸交易”、“原始或自然交易”,指的是从简单的价格行为价格图表进行交易。
The simple stripped-down approach of price action trading, means there are no indicators on a trader’s charts and no economic events or news is used in making one’s trading decisions. The sole focus is on a market’s price action, and the belief amongst price action traders is that this price action reflects all the variables (news events, eco. data etc.) that influence a market and cause it to move. Therefore, the implication is that it’s much simpler to just analyze a market and trade from its price action, rather than trying to decipher and sort the many different variables affecting a market each day.
价格行为交易的简单简化方法意味着交易者的图表上没有指标,也没有使用经济事件或新闻来做出交易决策。唯一关注的是市场的价格行为,价格行为交易者认为该价格行为反映了影响市场并导致市场波动的所有变量(新闻事件、生态数据等)。因此,这意味着仅从其价格行为分析市场和交易要简单得多,而不是试图破译和排序每天影响市场的许多不同变量。
Price Action Trading Strategies (Patterns)
价格行为交易策略(模式)
Price action patterns, also called price action ‘triggers’, ‘setups’ or ‘signals’, are really the most important aspect of price action trading, because it’s these patterns that provide a trader with strong clues as to what price might do next.
价格行为模式,也称为价格行为“触发器”、“设置”或“信号”,确实是价格行为交易中最重要的方面,因为正是这些模式为交易者提供了关于价格下一步可能做什么的有力线索。
The following diagrams show examples of some simple price action trading strategies that you can use to trade the market.
下图显示了一些可用于市场交易的简单价格行为交易策略的示例。
- Inside bar pattern 内条图案
An inside bar pattern is a two-bar pattern, consisting of the inside bar and the prior bar which is usually referred to as the “mother bar”. The inside bar is contained completely within the high to low range of the mother bar. This price action strategy is commonly used as a breakout pattern in trending markets, but it can also be traded as a reversal signal if it forms at a key chart level.
内条形图案是一种双小节状,由内条和前一根条组成,通常称为 “母条”。内侧 bar 完全包含在母柱的高到低范围内。这种价格行为策略通常用作趋势市场的突破形态,但如果它在关键图表级别形成,它也可以作为反转信号进行交易。

- Pin bar pattern 销杆模式
A pin bar pattern consists of a single candlestick and it shows rejection of price and a reversal in the market. The pin bar signal works great in a trending market, range bound market and can also be traded counter-trend from a key support or resistance level. The pin bar implies that price might move opposite from the direction the tail is pointing; as it’s the tail of the pin bar that shows rejection of price and a reversal.
针柱线形态由一根烛台组成,它显示价格被拒绝和市场反转。pin bar 信号在趋势市场、区间震荡市场中效果很好,也可以从关键支撑位或阻力位逆势交易。pin bar 意味着价格可能与尾部指向的方向相反;因为它是 pin bar 的尾部,显示拒绝价格和反转。

- Fakey pattern Fakey 模式
The fakey pattern consists of a false breakout of an inside bar pattern. In other words, if an inside bar pattern breaks out briefly but then reverses and closes back within the range of the mother bar or inside bar, you have a fakey. It’s called a “fakey” because it fakes you out, the market looks like its breaking one way but then comes back in the opposite direction and sets off a price movement in that direction. Fakey’s are great with trends, against trends from key levels and in trading ranges.
fakey 模式由内线模式的假突破组成。换句话说,如果内线形态短暂突破,但随后反转并收于母线或内线的范围内,那么您就有假的。它被称为“假货”,因为它欺骗了你,市场看起来像是以一个方向突破,但随后又回到相反的方向,并引发了那个方向的价格变动。Fakey 的趋势非常出色,与关键水平和交易区间的趋势相反。

Trading with Price Action Patterns
使用价格行为模式进行交易
Let’s look at some real-world examples of trading with price action patterns.
让我们看看一些使用价格行为模式进行交易的真实示例。
The first chart we are looking at shows us a bearish fakey sell signal pattern. In this example, the trend was already down, as we can see the overall downward track starting at the top left of the chart and falling as price moves toward the left side of the chart. Thus, this fakey sell signal was in-line with the overall daily chart downtrend, this is good. Trading with the trend generally gives a price action setup a better chance of working in your favor.
我们正在查看的第一张图表向我们展示了一个看跌的 fakey 卖出信号模式。在这个例子中,趋势已经下降,因为我们可以看到整体下降轨迹从图表左上角开始,并随着价格向图表左侧移动而下降。因此,这个虚假的卖出信号与整体日线图下降趋势一致,这很好。顺势交易通常会使价格行为设置更有可能对您有利。

The chart below shows an example of a bullish fakey pin bar combo setup in the context of an upward moving market. Typically, when a market has a strong near-term bias, meaning it’s been moving in one direction recently and aggressively, a price action trader wants to trade in-line with that near-term momentum.
下图显示了在向上移动的市场背景下看涨 fakey pin bar 组合设置的示例。通常,当市场具有强烈的近期偏见时,这意味着它最近一直在朝着一个方向积极移动,价格行为交易者希望根据该近期势头进行交易。

In this next example, we are looking at the inside bar trading pattern. This chart shows both a regular inside bar signal as well as an inside pin bar combo setup. An inside pin bar combo is simply an inside bar with a pin bar for the inside bar. These setups work very well in trending markets like we see in the chart below.
在下一个例子中,我们将研究内线交易模式。此图表显示了常规的内线信号以及内销柱组合设置。内针杆组合只是一个内杆,内杆有一个针杆。这些设置在下图所示的趋势市场中效果很好。

The last chart we are looking shows examples of the pin bar pattern. Note the large up moves that followed both of these pin bar buy signals. Also, note how these pin bars both had long tails in comparison to some of the other bars on this chart that you might identify as pin bars. Pin bars wit nice long tails like these two, and that are clearly protruding out from the surrounding price action, often are very good setups to trade.
我们正在寻找的最后一张图表显示了 pin bar 模式的示例。请注意这两个 pin bar buy 信号之后的大幅上涨。另外,请注意,与此图表上您可能认为是 pin bar 的其他一些条形相比,这些 pin bar 都具有长尾。像这两个这样的 pin bar 带有漂亮的长尾巴,并且明显从周围的价格走势中伸出,通常是非常好的交易设置。

Trading Price Action Patterns with Confluence
使用 Confluence 交易价格行为模式
Trading with price action signals is not only about the signal itself, but it’s also about where the signal forms on the chart. Every pin bar, inside bar, etc. is not created equal. Depending on where a particular price action signal forms in a market, you may not want to trade it or you may want to jump on it without hesitation.
使用价格行为信号进行交易不仅与信号本身有关,还与信号在图表上的形成位置有关。每个 pin bar、inside bar 等都不是一样的。根据特定价格行为信号在市场上形成的位置,您可能不想交易它,或者您可能想毫不犹豫地跳上它。
The best price action signals are those that form at ‘confluent’ points in the market. Confluence, simply means ‘a coming together’ of people or things. In the case of price action trading we are looking for an area on the chart where at least a couple things line up with a price action entry signal. When this happens, we say the price action signal ‘has confluence’.
最好的价格行为信号是在市场“汇合”点形成的信号。汇合,简单地说就是人或事物的“聚集”。在价格行为交易的情况下,我们正在图表上寻找至少有几个东西与价格行为入场信号一致的区域。当这种情况发生时,我们说价格行为信号 “汇合”。
In the chart example below, we can see a good example of a pin bar pattern with confluence. The confluence is that the pin bar has formed in the direction of an up-trending market and that it has formed at a support level in that uptrend. Thus, we have the confluence of the trend and the support level, together these things give the pin bar buy signal more weight than if they weren’t there supporting the signal. The more confluent factors a price action signal has behind it, the higher-probability signal it is considered to be.
在下面的图表示例中,我们可以看到一个具有 confluence 的针柱线模式的好例子。汇合点是 pin bar 已朝着上升趋势市场的方向形成,并且它已在该上升趋势的支撑位形成。因此,我们有趋势和支撑位的汇合点,这些因素共同赋予了 pin bar 买入信号比它们不存在支撑信号时更大的权重。价格行为信号背后的汇合因素越多,它被认为是概率更高的信号。

Conclusion 结论
I hope you’ve enjoyed this price action trading tutorial. You now have a solid basic understanding of what price action is and how to trade it.
我希望您喜欢这个价格行为交易教程。您现在对什么是价格行为以及如何交易它有了扎实的基本了解。
Going forward, you should look to expand your price action trading understanding and knowledge as there is much more to it than is covered here.
展望未来,您应该寻求扩展您对价格行为交易的理解和知识,因为它的内容远不止这里介绍的。


